Leavenworth Market Stats
The numbers I check before I price a listing or write an offer. Each chart covers the Leavenworth market area (NWMLS area 972), residential sales, as a rolling 12-month figure over the last three years, so one unusual month doesn't swing the picture. They update automatically each month when NWMLS publishes new data.
Numbers tell you the direction. For what a specific cabin or piece of land is worth, ask me for the recent sales that match it.
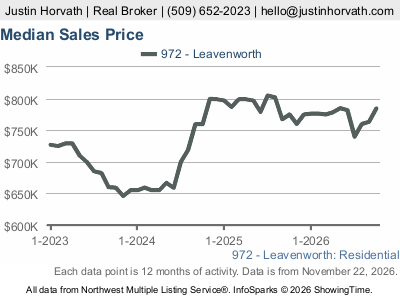
Median Sale Price
Half the homes sold for more, half for less. It moves slower than the headlines, which is the point: it shows where prices are actually settling.
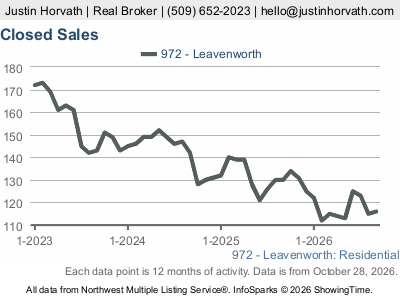
Homes Sold
How many homes closed. This is a small market, so a handful of sales either way is a real shift, and it is why I look at a rolling year instead of a single month.
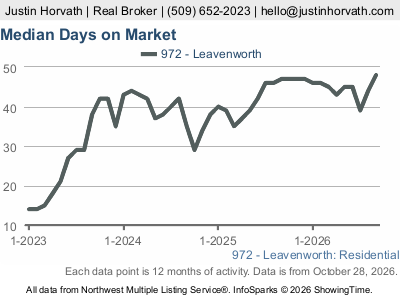
Days on Market
How long a typical home sat before going under contract. Longer times usually mean more room to negotiate; short ones mean the good ones still go fast.
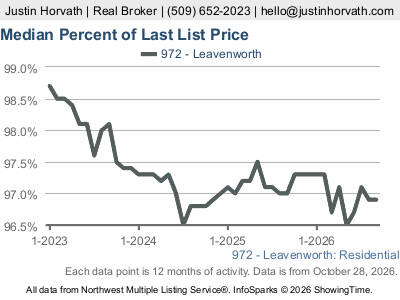
Percent of List Price Received
What sellers got compared with the asking price at the time of the sale. It is the most honest guide to how far below asking a realistic offer lands.
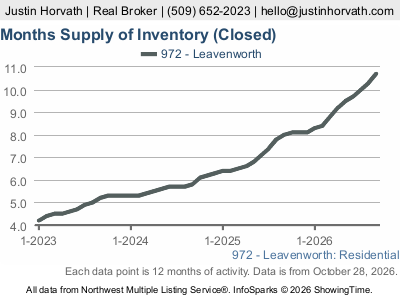
Months of Supply
How long the homes for sale today would take to sell at the recent pace. Under about 4 months favors sellers; over about 6 favors buyers.
Charts by InfoSparks, based on data from the Northwest Multiple Listing Service (NWMLS). Figures are for NWMLS area 972 and are not guaranteed. For town-by-town numbers (Plain, Lake Wenatchee, Peshastin, Cashmere), see the quarterly market snapshot and the area guides.
Want the numbers for a specific property?
Call or text me, or send a message, and I will pull the recent sales that match what you are looking at.